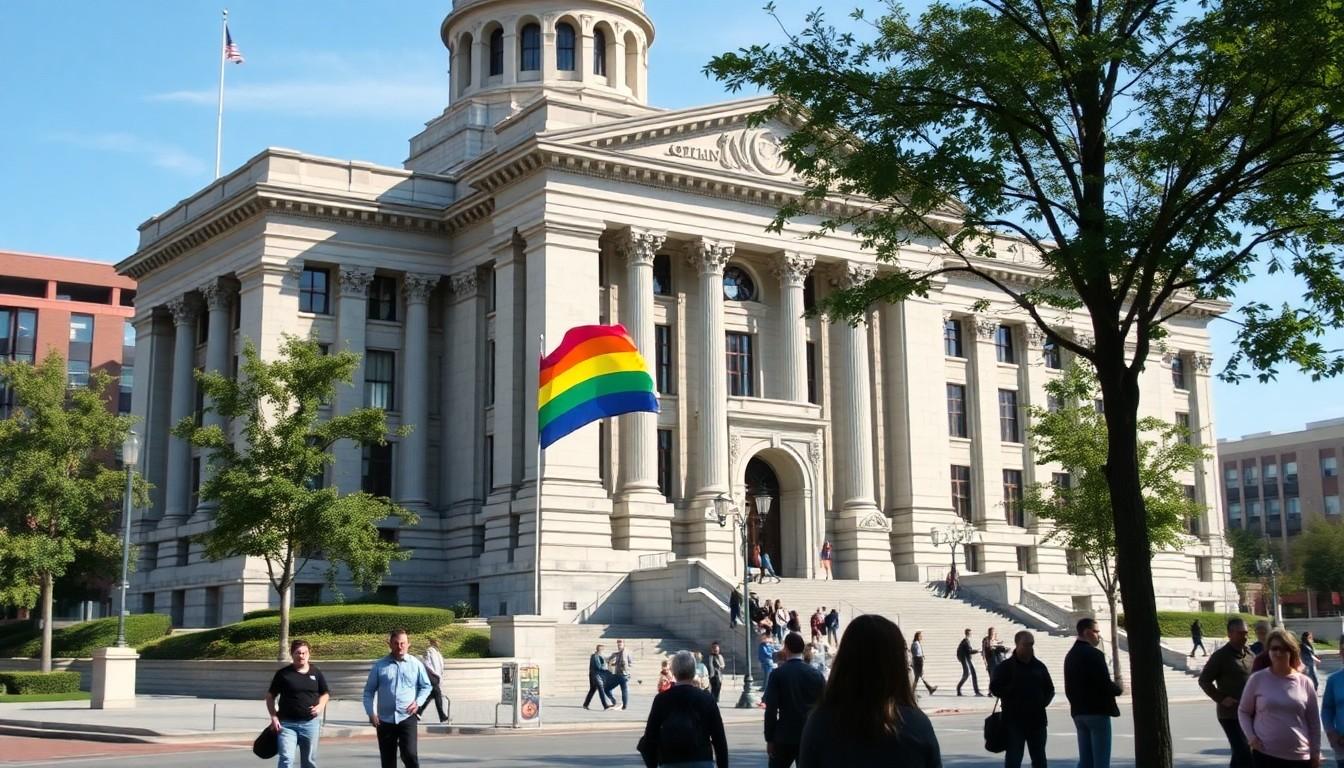
Researchers now estimate that nearly 883,000 LGBTQ+ adults live in Ohio, putting the state among those where more than one in 10 adults identifies as LGBTQ+. The updated figures matter because they reshape how policymakers, employers and brands understand a sizeable, increasingly influential community.
Essential Takeaways
- Ohio estimate: Around 11.29% of Ohio adults, or roughly 883,000 people, are estimated to be LGBTQ+.
- National picture: About 12% of US adults, equivalent to 25.6 million people, identify as LGBTQ+.
- Why the jump: The newer estimate uses a much larger online survey sample and more recent data than earlier research.
- Not a sudden surge: The figures don't mean hundreds of thousands of people recently moved or came out; they reflect improved measurement.
- A younger population: More than half of LGBTQ+ adults nationally are aged between 18 and 34, according to the analysis.
Ohio's LGBTQ+ population may be larger than previous estimates suggested
Ohio's LGBTQ+ community is considerably larger than older official estimates indicated. New research from the Human Rights Campaign Foundation puts the figure at about 883,000 adults, or 11.29% of the state's adult population. That means Ohio sits in a group of 40 states where more than one in 10 adults identifies as LGBTQ+.
The scale is striking, especially because the number feels less like a niche statistic and more like a visible part of everyday Ohio life. Columbus Underground reported the same state estimate, underlining how dramatically the picture differs from earlier research.
Nationally, the Human Rights Campaign estimates that 12% of US adults identify as LGBTQ+, representing around 25.6 million people. The organisation says the figures offer a clearer view of a population that is already shaping workplaces, elections, shopping habits and local communities. [2], [6]
Why the numbers changed so dramatically
Earlier research from the Williams Institute estimated that Ohio had around 557,600 LGBTQ+ adults, or 6.2% of the population. The gap between that figure and the newer estimate is more than 325,000 people, but it shouldn't be read as evidence of a sudden demographic wave.
The main difference is methodology. The newer analysis draws on the US Census Bureau's Household Pulse Survey from 2021 to 2024, while the Williams Institute used older data collected in 2020 and 2021. The newer project also pooled responses from approximately 2.4 million people, creating a broader base for state-level estimates.
Survey design matters too. Online self-reporting may make people more comfortable disclosing their sexual orientation or gender identity than a telephone interview. In other words, the change may tell us as much about visibility and measurement as it does about population trends. The Williams Institute's research provides an important comparison, but the two studies aren't measuring exactly the same thing. [3], [5]
A bigger sample gives researchers a clearer view
Large surveys can make a major difference when researchers are examining communities that have often been undercounted. A small sample may miss people in rural areas, younger adults or those who don't feel safe answering questions openly. Pooling millions of responses gives analysts more room to identify patterns without relying on guesswork.
The Human Rights Campaign's population estimates cover national and state-level results, allowing readers to compare broad trends with local realities. That makes the data useful beyond headline numbers. Public agencies can use it when planning services, while employers and community organisations can better understand who they serve.
Still, no survey is perfect. People may interpret identity questions differently, and some respondents will always choose not to disclose personal information. So the most useful takeaway isn't that one figure has magically settled the debate, but that better and more consistent data produces a more realistic starting point. [3], [4]
Younger LGBTQ+ adults could shape Ohio's future
The research also points to a significant generational shift. Nationwide, 53.8% of LGBTQ+ adults are aged 18 to 34, a group moving into years when people often make major decisions about careers, homes, spending and civic participation.
That has practical implications. Businesses that treat LGBTQ+ consumers as a small specialist audience may be overlooking a large and varied customer base. Employers, meanwhile, could find that inclusion affects recruitment and retention, particularly among younger workers who expect workplaces to reflect their values.
The political implications are just as substantial. A population approaching one in eight adults nationally, and more than one in 10 in Ohio, represents a broad constituency rather than a narrow interest group. It isn't a statistic that campaigns or institutions can sensibly ignore. [2], [7]
Data collection faces an uncertain road ahead
The timing of the research is important because future comparisons may become harder. The Human Rights Campaign says hundreds of federal data-collection opportunities concerning sexual orientation and gender identity have been removed, potentially creating gaps in the information available to researchers.
That could make independent surveys more important, but it may also make them more expensive and harder to sustain. Without regular data, policymakers risk planning around outdated assumptions, while local organisations may struggle to demonstrate the scale of need.
For now, the Ohio estimate offers a clearer, if still evolving, picture. It gives the community greater visibility on paper, which can be powerful in its own quiet way. Numbers don't capture every lived experience, but they can make it much harder for decision-makers to pretend the community is marginal. [2], [4], [7]
It's a reminder that better data can change not only the estimate, but the conversation around who counts.
Source Reference Map
Story idea inspired by: [1]
Sources by paragraph: