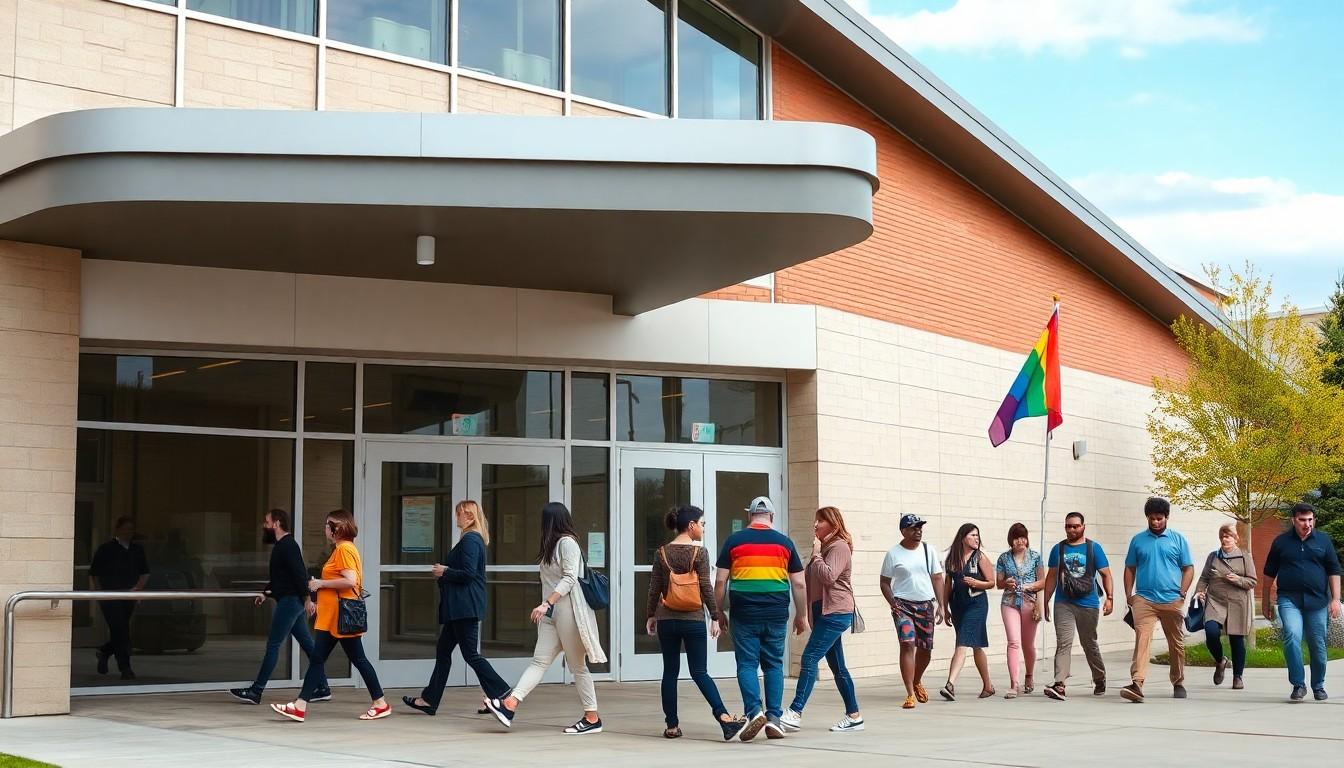
Researchers now estimate that 11.29% of Ohio adults identify as LGBTQ+, placing the state among those with the largest measured LGBTQ+ populations in the US. The updated figure matters because it reshapes how policymakers, employers and brands understand Ohio communities, while also highlighting the importance of collecting reliable identity data.
Essential Takeaways
- Ohio estimate: Around 11.29% of Ohio adults, or approximately 883,000 people, are estimated to be LGBTQ+.
- National picture: The Human Rights Campaign estimates that 12% of US adults identify as LGBTQ+, equivalent to about 25.6 million people.
- Why the figure is higher: The analysis uses a larger, more recent online survey sample than some earlier estimates.
- Not a sudden population surge: The change reflects different research methods and dates, rather than hundreds of thousands of people suddenly relocating or coming out.
- A younger demographic: More than half of LGBTQ+ adults nationally are aged between 18 and 34, according to the HRC analysis.
Ohio's LGBTQ+ estimate is bigger than earlier figures
The headline number is striking: researchers estimate that roughly 883,000 adults in Ohio identify as LGBTQ+. That works out at 11.29% of the state's adult population, putting Ohio among the 40 US states where the estimated share is above 10%.
The Human Rights Campaign Foundation reached the figure using data from the US Census Bureau's Household Pulse Survey, collected between 2021 and 2024. According to the HRC, the analysis combined responses from around 2.4 million people, creating a broad base for national and state-level estimates.
That scale matters. Identity research can be sensitive, and people may answer differently depending on how a question is asked, who is asking and whether the response feels private. An online form can create a quieter, less exposed moment than a telephone interview.
Why the numbers differ from older research
A previous Williams Institute estimate put Ohio's LGBTQ+ adult population at about 557,600, or 6.2% of the state's population. The gap between that figure and the newer estimate may look dramatic, but it shouldn't be read as evidence of a sudden demographic wave.
The two studies used different time periods and approaches. The Williams Institute figure drew on 2020 and 2021 data, while the HRC analysis covered a later period. The surveys also differed in how participants were contacted and invited to disclose their identity.
The HRC's research team has stressed that changing estimates don't mean roughly 326,000 people have newly moved to Ohio or come out since the earlier report. Instead, the higher result shows how sampling, privacy and survey design can influence what researchers are able to measure.
A larger population means greater influence
The figures also point to a wider shift in American life. The HRC estimates that 12% of US adults, around 25.6 million people, identify as LGBTQ+, making the community a substantial part of the country's electorate, workforce and consumer base.
More than half of LGBTQ+ adults nationally are aged 18 to 34. That gives the findings a long tail, as younger adults move through their peak earning, spending and voting years. It also helps explain why visibility is increasingly tied to practical questions about housing, healthcare, workplace culture and political representation.
The point is less about chasing a single perfect percentage and more about understanding the scale of the community. As the HRC has argued, LGBTQ+ people aren't a niche audience that organisations can simply address once a year and forget.
Better data is becoming harder to secure
The research arrives with a warning. Future estimates may become more difficult if federal agencies collect less information about sexual orientation and gender identity.
That creates a frustrating tension: public bodies need dependable data to understand communities and plan services, but the questions required to gather that information can become politically vulnerable. Without consistent tracking, researchers may find it harder to distinguish genuine demographic change from shifts in survey design.
For Ohio, the immediate message is clear enough. Whether the final percentage settles above or below this estimate, LGBTQ+ residents represent a large and established part of the state. That should be difficult for campaigns, employers and businesses to overlook.
The numbers are only one part of the story, of course. Behind every estimate are people deciding how openly they can live, work and participate in public life. Good research doesn't replace those experiences, but it can make them harder to ignore.
Better data makes better decisions, and Ohio's LGBTQ+ community is too significant to be treated as an afterthought.
Source Reference Map
Story idea inspired by: [1]
Sources by paragraph: